

With the help of Claude, I pulled every edition of thirteen humanitarian flagship publications from 2022 to 2026 into one folder — sixty PDFs. Then I went looking for what they cost to produce, which turned out to be the more interesting half of the exercise.
This is a guide to the instruments we use to describe the sector every year, and which shape decisions organisations take: which one answers which question, how to quote them without getting caught out, where the holes are, and what the whole apparatus costs relative to what industry spends knowing about far smaller things.
The publishing calendar
Most of these reports are annual and they land in a predictable order. As a consequence, between January and April you are working with figures that are already a year old and an appeal written the previous November. And if you are drafting anything in May or June, wait: displacement, food security and funding all refresh within about six weeks of each other. Not a big deal, but something to have in mind.
| When | What lands | Covers |
|---|---|---|
| December | OCHA Global Humanitarian Overview; IRC Emergency Watchlist | The year ahead |
| March–April | CRED Disasters in Numbers (EM-DAT) | Previous calendar year |
| April–May | Global Report on Food Crises; IDMC Global Report on Internal Displacement | Previous calendar year |
| June | UNHCR Global Trends; Global Humanitarian Assistance report; NRC most neglected crises; GHO mid-year review | Previous calendar year |
| August | Aid Worker Security Report | Previous calendar year |
| October | Grand Bargain self-reporting highlights | Previous calendar year |
| Irregular | IFRC World Disasters Report; UNDRR Global Assessment Report | Thematic |
| Every four years | ALNAP State of the Humanitarian System | The previous four years |
Which report answers which question
| Theme | Source / publication | Notes and timing |
|---|---|---|
| Needs, risk and crisis prioritisation | Global Humanitarian Overview (GHO) | December release with June mid-year review; an appeal document rather than a pure needs assessment |
| IRC Emergency Watchlist | Focuses on 20 countries, with the top 10 ranked | |
| NRC Most Neglected Displacement Crises | Weighs funding, media coverage and political neglect; now incorporates scale | |
| Sectoral crises and population movement | Global Report on Food Crises (GRFC) | Built systematically on IPC/CH analyses |
| UNHCR Global Trends | Tracks end-of-year population stocks as well as annual movement flows | |
| IDMC Global Report on Internal Displacement (GRID) | Distinguishes displaced people (stocks) from displacement movements (flows) | |
| Disaster impact, risk reduction and economics | CRED Disasters in Numbers / EM-DAT | Covers natural hazards only |
| UNDRR Global Assessment Report (GAR) | Released roughly biennially, alongside thematic special reports | |
| Financing, operational performance and reform | Global Humanitarian Assistance (GHA) report | The only consolidated financing picture; produced by ALNAP since 2025 |
| ALNAP State of the Humanitarian System (SOHS) | Comprehensive sector performance review, every four years | |
| Grand Bargain reporting | Tracks system commitments; the independent annual review ended after 2023 | |
| Security and duty of care | Aid Worker Security Report (AWSR) / AWSD | Annual report backed by an open, year-round queryable database |
Other annual publications worth tracking
These are not in the library, but they answer questions the thirteen do not.
- UN Secretary-General — Protection of Civilians (annual, May). The UN's minimum count of civilian deaths in conflict.
- UN Secretary-General — Children and Armed Conflict (annual, June). Verified grave violations and the "list of shame" annexes.
- Save the Children — Stop the War on Children (annual). With PRIO, the standard source on children living in conflict zones.
- ACAPS — Humanitarian Access Overview (twice a year). The only systematic cross-country ranking of access constraints.
- INFORM Risk (EC JRC / IASC; annual plus mid-year). The standard crisis-risk index used for prioritisation.
- CERF Annual Results Report (annual). Pooled-fund allocations, including the underfunded-emergency rounds.
- FAO et al. — State of Food Security and Nutrition in the World (SOFI, annual). Chronic hunger; complements the GRFC's acute focus.
Six rules for quoting these numbers
The edition year is not the data year. The GHO 2026 was published in December 2025 and plans for 2026. The GRFC 2026 came out in April 2026 and describes 2025. NRC and CRED name editions after the data year, so NRC's 2025 list appeared in June 2026. Your citation has to distinguish publication from reference period.
Figures are revised between editions. International humanitarian assistance for 2022 appears as US$46.9bn in the GHA 2023, US$43.9bn in Development Initiatives' 2024 report, US$47.5bn in the SOHS 2026 executive summary and US$46.1bn in the same report's performance table. Deflators, revised FTS data, different inclusion rules. Quote a figure with its edition.
Never mix editions inside one series. Do not build a five-year trend by taking each year's figure from the edition published that year. Aid worker deaths are the clean example: 2023 was printed as 280 and is now 297, 2024 as 383 and now 387. A trend built from printed figures shows a smaller 2023→2024 jump than a trend built from the current database. Take every point in a series from the same source vintage — ideally the latest edition, which restates all prior years on one basis.
Coverage changes move the trend line. The GRFC's country set expanded from 48 to 73 for the 2023 edition, inflating the year-on-year rise. In 2026 the reverse: eighteen countries had no usable data, the lowest coverage in a decade, so part of the fall from 295 to 266 million people in acute food insecurity is missing data rather than improvement. IDMC says the same of its own 2025 figures — reduced data availability in fifteen per cent of monitored countries, triple the previous year.
When the measuring apparatus is losing funding at the same time as the thing it measures, a falling number is ambiguous by default. Check the coverage note before you write the sentence — this is more relevant now than it has been at any point in the period.
Methodology changes break series. The Aid Worker Security Database began systematically recording detentions in 2025 and backfilled earlier years, so 2025's record total is partly definitional even though deaths fell. NRC added scale of displacement as a fourth criterion in 2026, which is largely why Sudan entered at number one.
Know which denominator you are using. People in need, targeted, prioritised and reached are four different numbers. For 2026: 239 million in need, 135 million targeted, 87 million in the hyper-prioritised core. SOHS 2026 records the compression — the share of people in need who were targeted fell from 67% in 2023 to 60% in 2025, with 38% hyper-prioritised. Using "people in need" where you mean "people we plan to reach" overstates coverage by a factor of nearly three.
Where the holes are
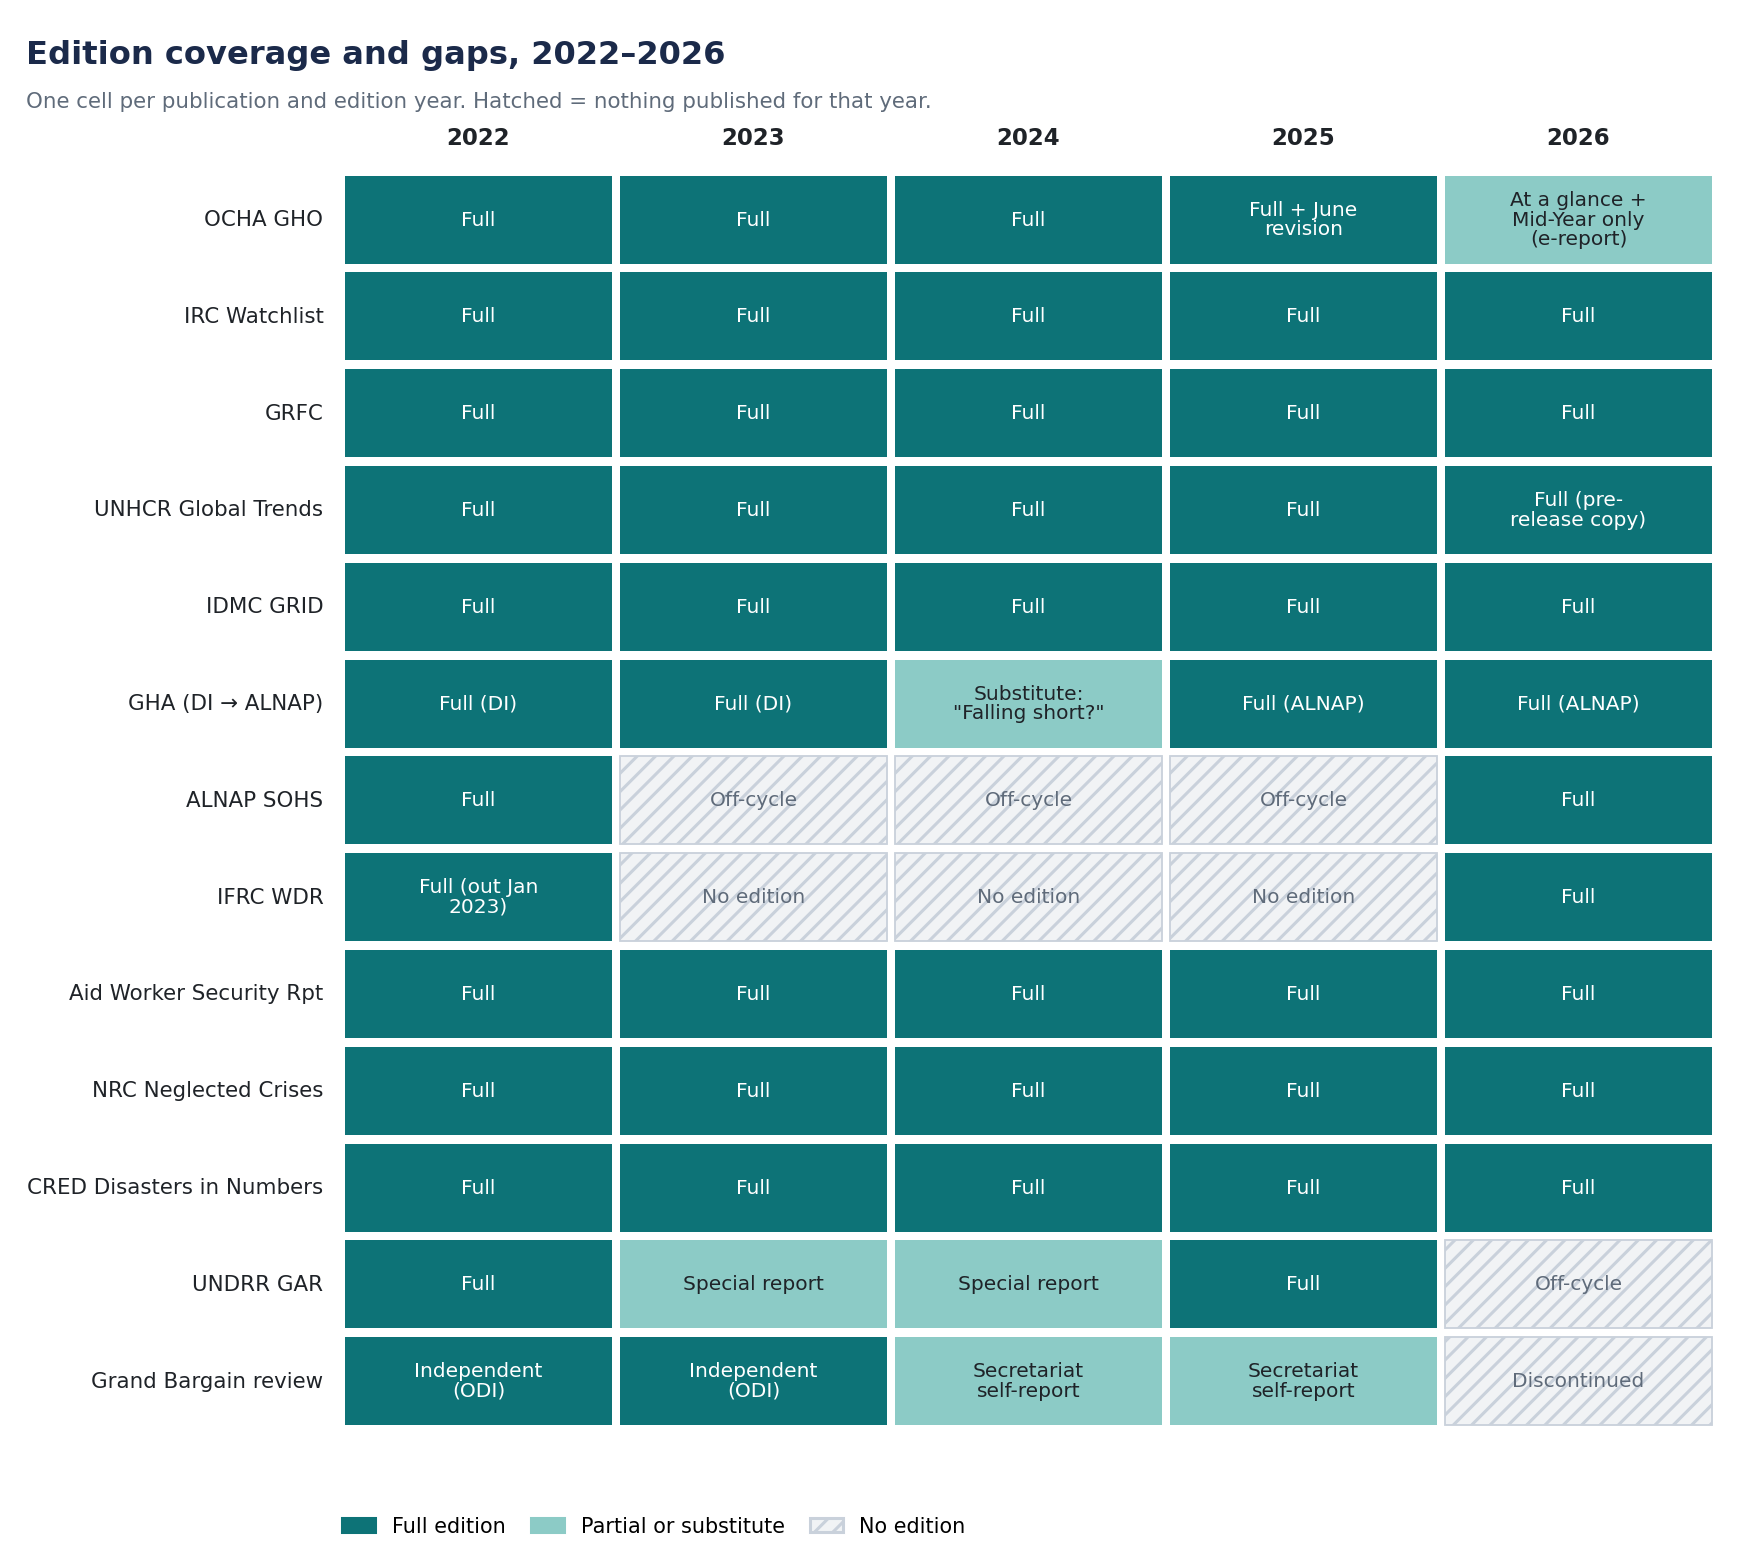
Four of the thirteen series have gaps in this period, of four different kinds.
- By design. The SOHS appears every four years — ALNAP says the interval lets it capture major shifts while tracking long-term trends — and each edition covers the four years since the last, although this periodicity has changed since its inception. UNDRR alternates full GAR editions with special reports.
- By governance decision. The Grand Bargain's independent review, written by ODI/HPG, ended after 2023 when signatories agreed to simplify reporting under the Grand Bargain 3.0 framework. What replaced it is a Secretariat summary of self-reported data that the Secretariat says it cannot verify. The Grand Bargain's mandate expires in 2026.
- Unexplained. IFRC published no World Disasters Report between the 2022 edition (which came out in January 2023) and March 2026.
- By attrition. The GHO 2026 exists only as an online e-report plus summary PDFs, in a year when OCHA cut about a fifth of its staff against a US$58 million shortfall. OCHA has not linked the two. But if you are building an archive, the full-report PDF you are used to filing no longer exists.
What USAID was paying for
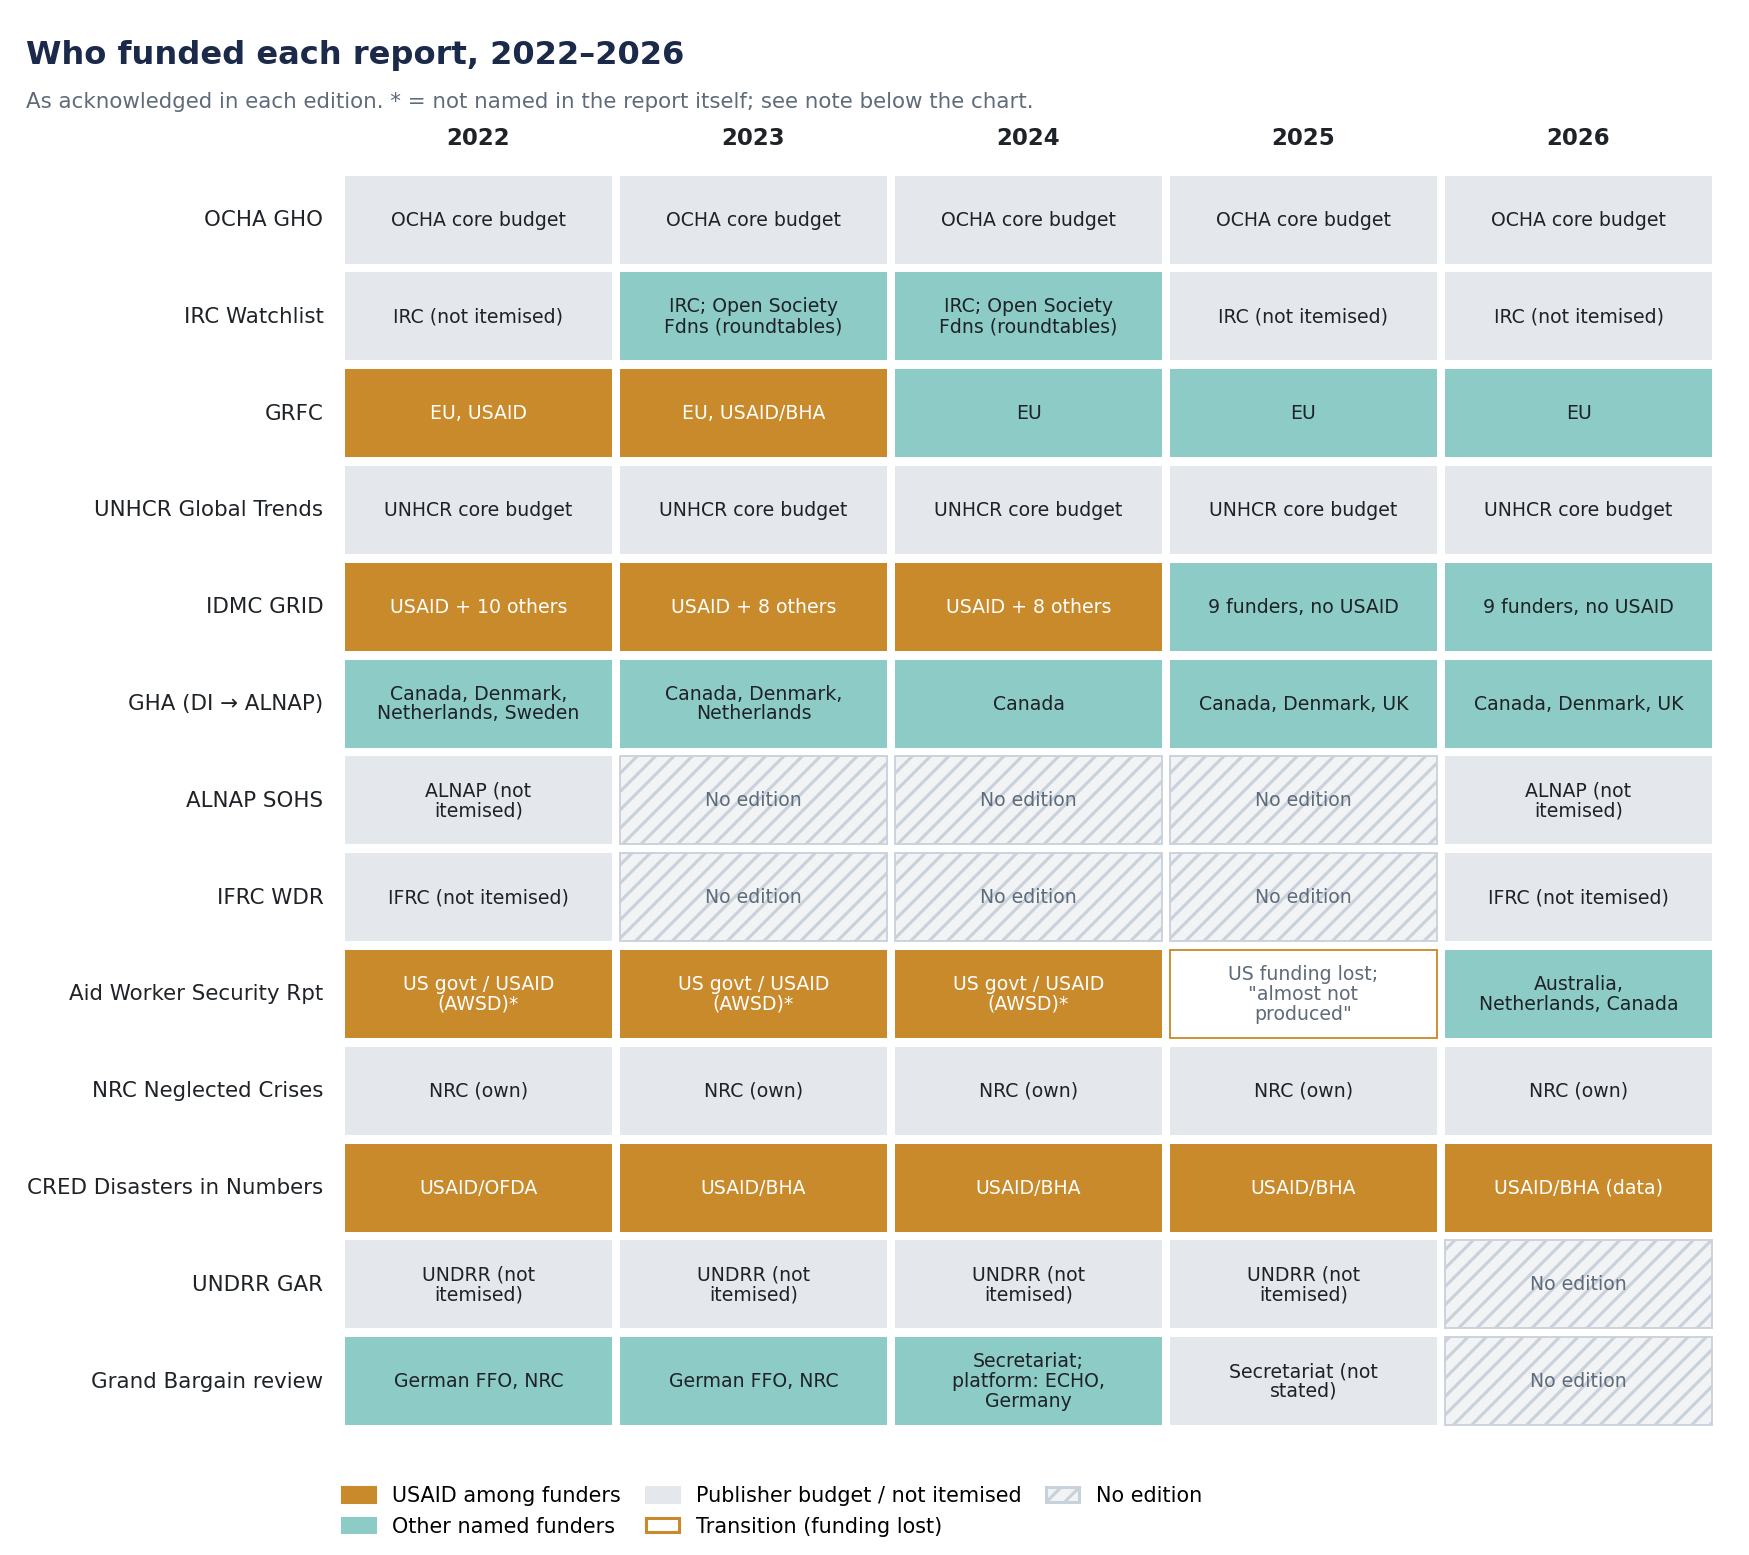
USAID co-funded the Global Report on Food Crises in 2022 and 2023, and was a named funding partner of IDMC's displacement report from 2022 to 2024. It appears in neither now. It paid for roughly ninety per cent of EM-DAT's €300,000 budget — the four-researcher operation behind almost every disaster mortality figure in our proposals; CRED was notified in February 2025 and still had no replacement in writing fifteen months later. Humanitarian Outcomes states that the 2025 Aid Worker Security Report was almost not produced after its database lost US government funding. FEWS NET, four decades of famine early warning, went dark for six months. Development Initiatives, which produced the Global Humanitarian Assistance report for twenty-five years, closed — ALNAP's own State of the Humanitarian System calls it a casualty of the cuts. And ALNAP, which inherited that report, had USAID as its single largest funder at twenty-eight per cent of income.
What the whole thing costs
Nobody appears to publish what the humanitarian sector spends on knowing things. Funding is coded by donor, recipient, crisis and channel — never by function — so there is no "assessment, information management and analysis" line anywhere in FTS, OECD DAC or the GHA report's own taxonomy.
So I reconstructed it from published accounts, grant records and procurement data, in two layers.
Producing the thirteen reports costs roughly US$8–17 million a year, midpoint about US$12 million. Some of that is anchored in the publishers' own accounts: IDMC spent US$7.0 million in 2023 with 64 staff; ALNAP £2.0 million in 2024–25 with 17 staff, producing both the SOHS and, since 2025, the GHA report; Humanitarian Outcomes received CAD 400,000 from Canada for sixteen months of core research including the Aid Worker Security Database; CRED runs EM-DAT on about €300,000 a year with four researchers. The rest — the GHO, the GAR — is estimated, because OCHA and UNDRR have never published what their flagships cost.
The data systems underneath add about US$52 million a year, and here the figures are mostly public, because they are grant-funded programmes rather than in-house activities: FEWS NET at roughly US$30 million a year (US$213 million obligated between 2019 and 2026), the IPC's global support programme at about US$8 million, IDMC's monitoring operation, the World Bank–UNHCR Joint Data Center at US$4.7 million, and OCHA's Centre for Humanitarian Data at around US$1.8 million.
Against the 2025 appeal of US$47 billion that is about 0.13%; against the US$33.3 billion actually spent, about 0.19%. And it is a floor — it excludes needs assessments, the JIAF, cluster information staff, REACH's multi-sector assessments, UNHCR's statistics function and agency monitoring, none of which publish a figure.
What the world spends knowing about other things
What else in the world costs about US$60 million a year to know about?
Barb Audiences, the company that measures what British households watch on television, ran on £40.7 million in 2024 with fourteen employees and a seven-thousand-home panel. Knowing what one country watches on TV costs roughly four-fifths of what the world spends on its entire shared humanitarian evidence base.
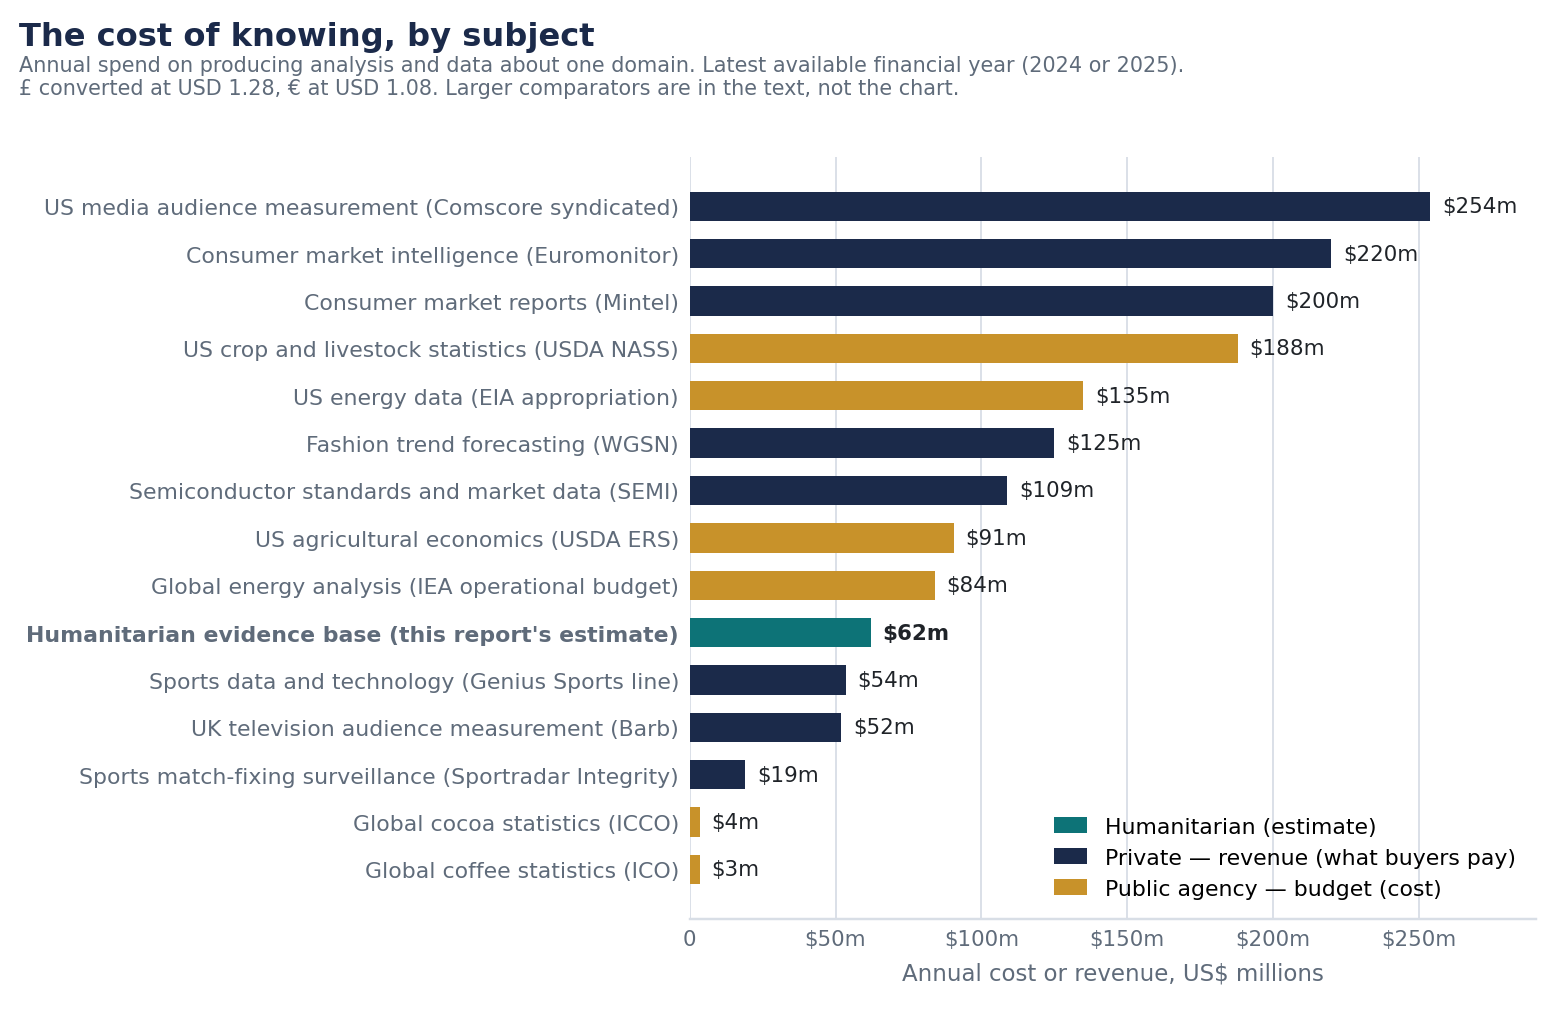
Just above the line: WGSN, which tells clothing brands what colours will be fashionable in eighteen months, turned over £91.3 million at a 45% EBITDA margin. Mintel and Euromonitor, two publishers of consumer market reports, took about US$200 and US$220 million. Comscore's syndicated audience business, counting who watched which advertisement, took US$254 million. On the public side, the United States spends US$135 million a year on energy statistics through the EIA and US$188 million on crop and livestock statistics through USDA NASS — each, for one country and one commodity class, more than the world spends on humanitarian analysis for everywhere.
The UK Office for National Statistics cost £374.8 million in 2024–25. Sportradar, selling sports data to bookmakers, earned €1.29 billion. L'Oréal spent €1.38 billion on research and innovation with four thousand scientists — about twenty-two times the humanitarian evidence base, on cosmetics.
In the other direction, to avoid dramatising: the International Coffee Organization maintains global coffee statistics on £2.7 million a year with fifteen posts, and the International Cocoa Organization runs global cocoa statistics on €3.3 million, partly funding itself by selling the data. Both are an order of magnitude below the humanitarian evidence base.
A system this cheap is not robust, and it breaks when one funder leaves.
The five-year review
Below is what each year's editions actually said. Years here are edition years (the year of publication). Each set describes the previous calendar year, except the GHO and the IRC Watchlist, which look forward.
2022 editions — reporting on 2021, published as Ukraine began. The GHO asked for US$41 billion for 183 million of 274 million people in need, up from 235 million a year earlier. UNHCR counted 89.3 million forcibly displaced at end-2021 and IDMC a then-record 59.1 million IDPs, with Ethiopia's 5.1 million conflict displacements the highest ever recorded for a single country in one year. The GRFC put 193 million people in IPC Phase 3 or worse — nearly 40 million more than 2020 — and 570,000 in Catastrophe across Ethiopia, South Sudan, Yemen and southern Madagascar. Funding was flat at US$31.3 billion, and direct funding to local actors fell to 1.2%, the lowest in the series. The SOHS 2022 reported that the system reached about 46% of the people it had itself identified as in need.
2023 editions — reporting on 2022: Ukraine, the Horn of Africa drought, the largest displacement increase ever recorded. The GHO launched at a record US$51.5 billion for 230 million of 339 million in need — 65 million more people than the year before. Forced displacement rose 21% to 108.4 million; the IDP stock rose 20% to 71.1 million on a record 60.9 million internal displacements, of which Ukraine accounted for roughly 16.9 million movements and Pakistan's floods 8.2 million. Food insecurity rose for a fourth consecutive year to 258 million, with 214,100 of the 376,400 people in Catastrophe in Somalia alone. International humanitarian assistance hit an all-time high of US$46.9 billion while the appeals shortfall hit an all-time high of US$22.1 billion.
2024 editions — reporting on 2023: Sudan, Gaza, and the first deliberately leaner appeal. The GHO asked for less than the previous year — US$46.4 billion for 180.5 million of 299.4 million in need — the first explicit narrowing of ambition. Gaza accounted for 576,600 of the 705,000 people in IPC Catastrophe, the highest total in GRFC history, and for 3.4 million displacements in the last quarter of 2023 alone. Sudan reached 9.1 million IDPs, the most ever recorded for one country. Humanitarian Outcomes counted 280 aid workers killed — the deadliest year on record at the time — 163 of them in Gaza in the war's first three months, with 57% of all deaths caused by aerial bombardment, a method almost exclusively available to states. Funding stalled at US$43.4 billion (−1.1%), appeal coverage fell to 45%, and Development Initiatives projected a further 11% fall.
2025 editions — reporting on 2024, published into the collapse. Every indicator set a record in the wrong direction: 83.4 million IDPs, above 80 million for the first time; 1.9 million people in Catastrophe, the highest since GRFC reporting began; 383 aid workers killed; Sudan at 11.6 million IDPs; food insecurity up for a sixth consecutive year to 295.3 million. ALNAP's first GHA edition reported that assistance had fallen 10% in 2024 — "the largest cut ever recorded" — and modelled public donor funding down 34–45% from the 2023 peak. Then the January 2025 US freeze arrived mid-cycle. OCHA rewrote the appeal in June under the title The Cruel Math of Aid Cuts: 114.4 million people identified for hyper-prioritised assistance out of 305 million in need, needing US$29.1 billion — of which 18.5% had been received by 10 June.
2026 editions — reporting on 2025: a smaller system. The GHO was built around hyper-prioritisation from the start: 239 million in need, 135 million targeted, 87 million in the prioritised core, US$33 billion requested, about 30% below the 2025 ask. Assistance fell 20% to US$33.3 billion, the US share of government funding dropped to about 23%, and the UAE and Saudi Arabia entered the top five donors. Two famines were confirmed in the same year, in Gaza and Sudan. For the first time in a decade both global forced displacement and the IDP stock declined — but largely through returns under duress and through data that no longer exists: the GRFC 2026 has its lowest coverage in a decade, with eighteen countries lacking usable analysis, so part of the fall from 295 to 266 million is arithmetic rather than improvement. The SOHS 2026 supplies the summary judgement: the share of people in need who were even targeted fell from 67% in 2023 to 60% in 2025, and the system entered 2026 smaller, more fragile, and facing open questions about its role.
The 274 million people in need in the 2022 edition and the 239 million in the 2026 edition are not the same measurement. Needs did not fall by 35 million; the definition of who counts tightened under funding pressure, the GHO moved from planning for everyone in need to planning for a prioritised core, and assessment coverage shrank. The series that runs most cleanly is the funding one, because it is counted rather than estimated — and taken from a single edition, the SOHS 2026, it reads as a peak of US$46.1 billion in 2022, a 13% fall in 2024 and a further 20% in 2025, to US$33.3 billion. Note that this is not the same 2024 decline as the 10% reported by the GHA 2025 above: different edition, revised data, same direction.
What I would actually do with this
Keep local copies. Publisher URLs rot faster than you expect: the FSIN links for older GRFC editions are dead, and the only reliable copy of the 2022 report I found was in a CGIAR repository. Download the PDF on publication day, one folder per series.
Cite the edition, not the report. "GRFC 2025, p. 12" ages well. "The GRFC says 295 million" will be changed in the next revision.
Go to the annexes and the data. The GHO master dataset is on HDX, EM-DAT and the AWSD are queryable, IDMC publishes country tables, and the GHA figures come from FTS and OECD DAC. For anything you will reuse, take the number from the data and use the report for the framing.
Write down which denominator you used. In the same year, the gap between people in need and people prioritised is 152 million, so it does matter to say what you are counting.
Thirteen series, sixty editions, 2022 to 2026, with a year-by-year summary, the funding and coverage charts and the cost workings. Assembled for internal use — happy to share it as a reference for your team.
